python-week-7-assignment
Iris Dataset - Exploratory Data Analysis
This repository contains a small exploratory analysis of the classic Iris dataset using Python, pandas, matplotlib, and seaborn.
The project focuses on a reproducible, script-based workflow (no Jupyter required).
Quick Preview
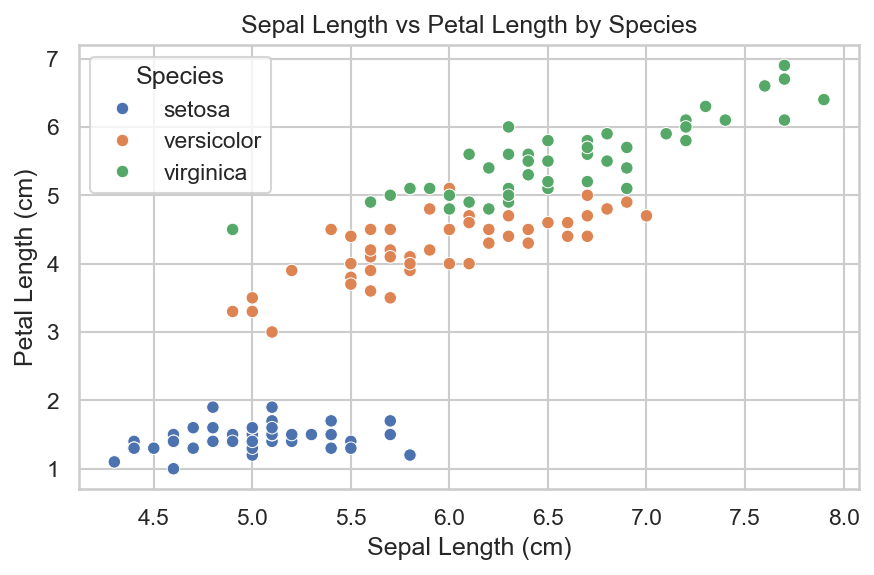
Example scatter plot generated by the script:
Project Structure
iris_analysis.py→ Python script: load dataset, run basic analysis and (optionally) export plotsiris_analysis.ipynb→ Colab notebook with interactive exploration and visualizationsimages/→ Sample visualization images (committed for preview)requirements.txt→ Python dependenciesREADME.md→ Project documentation
Requirements
Create a virtual environment and install dependencies:
python -m venv venv
# Windows PowerShell
venv\Scripts\Activate.ps1
# Linux / macOS
# source venv/bin/activate

pip install -r requirements.txt
How to Run
Run the analysis script (prints dataset information and summary to console):
python iris_analysis.py
Generate and save example plots to images/:
python iris_analysis.py --save-figs
Analysis Performed
- Dataset information and missing-value checks
- Descriptive statistics: (
df.describe()) - Group-by species: mean measurements per class
- Visualizations:
- Line chart: Sepal length and width trends
- Bar chart: Average petal length by species
- Histogram: Distribution of petal width
- Scatter plot: Sepal length vs petal length (colored by species)
Insights
- Setosa has significantly smaller petal length and width compared to other species
- Virginica generally shows the largest values across features
- No missing values were detected; the dataset is clean and consistent
License
This project is distributed under the MIT License. See LICENSE.
About the Author
- Name: Augusto Mate
- E-mail: mate.augusto.mz@gmail.com
Version 1.0.0 has been released! See the release page for full details.